We’re thrilled to announce the launch of the Benchmark Data Dashboard, a powerful new tool designed to give you deeper insights into your students’ progress.
Enhanced Teacher Visibility into Benchmark Scores and Progress
The Benchmark Data Dashboard provides you with a centralized hub for all student benchmark data, giving a clear view of:
- Class and Grade Level Performance: See how your entire class or grade level is performing on benchmarks.
- Individual Student Progress: Track student growth over time by comparing scores across benchmarks.
- Performance Levels: Quickly identify students’ strengths and weaknesses based on performance levels in speaking and writing.
The Benchmark Data Dashboard is designed to save you time by eliminating the need to sift through individual student data. The clear insights from the dashboards empower you to tailor instruction and support to each student’s specific needs. Furthermore, you can track student growth over time and identify areas for improvement, while also gaining valuable insights that can help you anticipate student performance on upcoming state language assessments.
Key Updates
The Benchmark Data Dashboard offers two key landing pages to give you a comprehensive picture, plus a deep dive into every students’ unique benchmark performance.
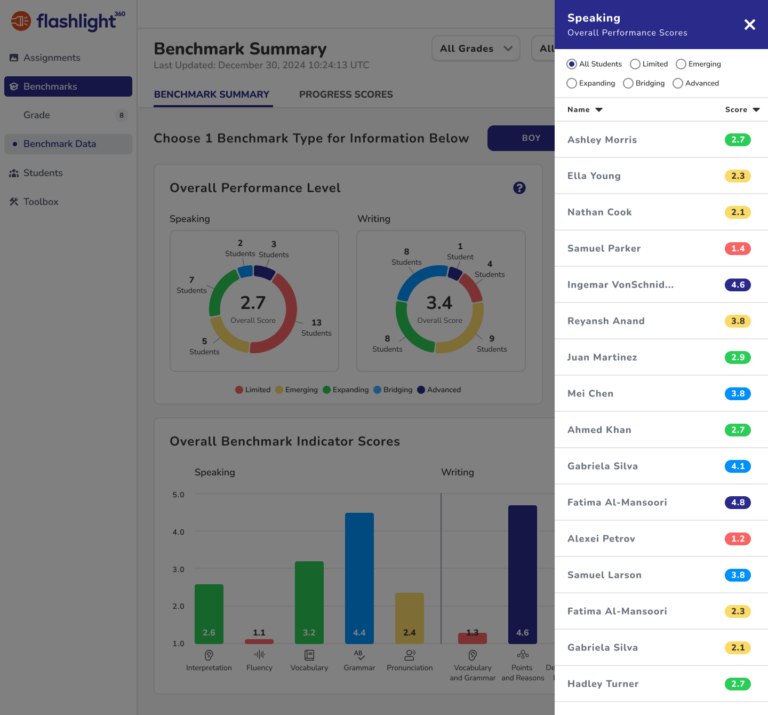
Benchmark Summary Page
This is your one-stop shop for a quick snapshot of class or grade-level data. Visualizations like graphs and color-coded widgets make it easy to see performance levels, submission status, and individual student breakdowns.
- Find your data: Go to the “Benchmarks” tab and click “Benchmark Data” in your Flashlight360 Teacher Dashboard.
- See your class performance: The first page (“Benchmark Summary”) shows your class or grade level’s results for a chosen benchmark (BOY, MOY, or EOY).
- Filter for specific students: Narrow down results by grade or subgroups within your class using the filters at the top.
- Visualize speaking & writing: Charts show how many students scored in each performance level.
- See details by level: In the “Overall Performance Level” section, click a performance level to view a slideout containing a list of students in that category. Your students’ scores will also help you navigate to their individual progress reports, so you can track benchmark performance over the course of the school year.
- Keep track of student submissions: Click “see submission list” to view a slideout containing which students have started, completed, and have received a grade. Here, again, educators can “zero in” on individual student performance with a simple click to easily route to the Individual Progress page.
Progress Scores Page
Take a dive into individual student progress with this page. You’ll see year-to-date changes, benchmark scores side-by-side, and the ability to quickly access specific student data. Want to dig in deeper? Select a student from your roster to view the beautiful Individual Progress report!
- See all benchmarks: Click “Progress Scores” to see all BOY, MOY, and EOY benchmarks in one report.
- Track growth: This report shows how student scores have changed throughout the year.
- Focus on a student: Type a student’s name to see their individual scores quickly.
Individual Progress Page
When you need a snapshot of your student’s progress from one benchmark to the next, as well as time-saving summaries of your student’s speaking and writing performance, this is a perfect report to download or print and share with parents and stakeholders throughout the school year.
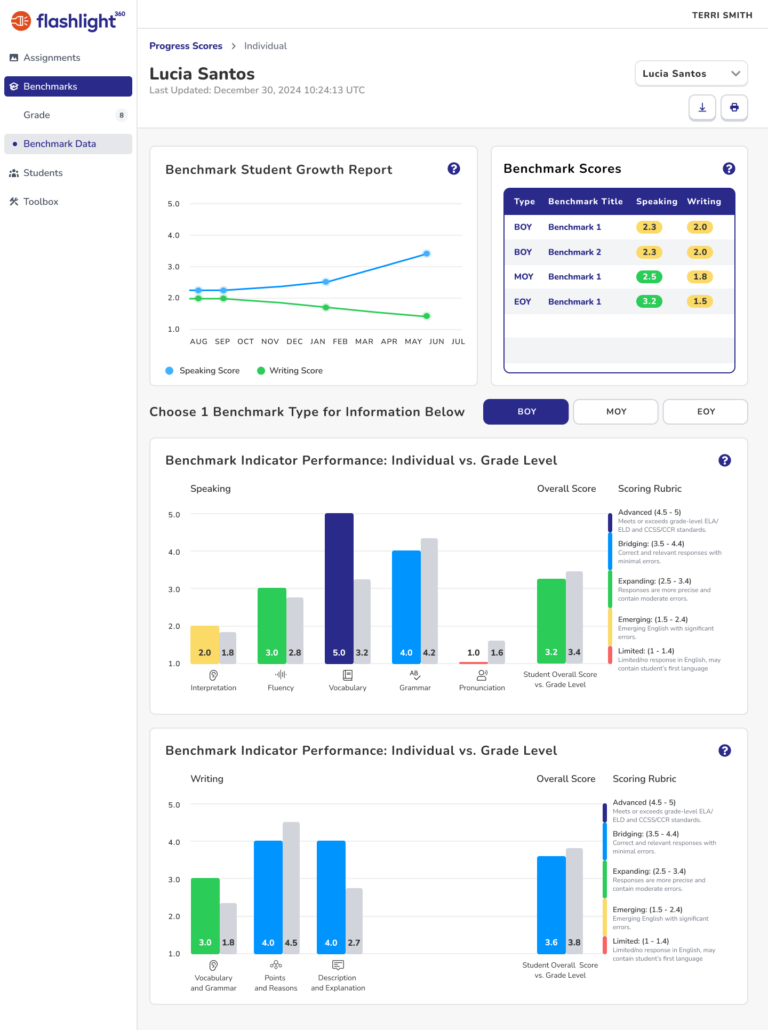
- Track growth: This page shows how student scores have changed from one benchmark assessment to the next.
- See student submissions: Select a specific benchmark type from the scores table to see your student’s BOY, MOY, and EOY scored submissions.
- Focus on an indicator: Track speaking and/or writing indicator scores from BOY to MOY to EOY for your student.
Better Insights Enables Better Personalized Learning
The Benchmark Data Dashboard is designed to save you time by eliminating the need to sift through individual student data. The clear insights from the dashboard empower you to tailor instruction and support to each student’s specific needs. Furthermore, you can track student growth over time and identify areas for improvement, while also gaining valuable insights that can help you anticipate student performance on upcoming state language assessments.
What’s Coming Next?
We want to hear from you as we design and build additional features to unlock these important capabilities. If you’d like to provide feedback to our product team and help guide the future of Flashlight360, please reach out to product@flashlight360.com.
Additional Resources
Click here to access a Loom video recording from our Customer Success team, explaining how to take advantage of this new feature.
Click here to view the Help Center Article with step-by-step instructions for accessing student benchmark data.
To stay up-to-date on the latest Flashlight360 product updates and features, subscribe to our newsletter or follow us on social media.

